
SOM (Self Organizing Maps) is an Artificial Neural Network technique. It is also a data clustering and dimension reduction technique. Visualization
and analyzing tool for high-dimensional data.
Moreover it's an unsupervised learning technique, which means it learns without a teacher.
Competitive learning technique. This means the neurons in the SOM learns by competing with each other to become the winner.
SOM (Self Organizing Maps) has many variations and here we are referring to Kohonen’s
SOMs as SOMs.
Difference between supervised unsupervised learning
Should be there someone to provide guidance in learning?
Supervised learning example can be a mother teaching you to recognize an apple, first
show an apple and say the word apple. Next time you see an apple you’ll say
that’s an apple. Mother is your teacher.
Unsupervised learning if you were given black/blue/red color
buttons and ask you to separate depending on colors, you’ll do it by yourself
probably. You won't need a teacher.
What's the inspiration behind SOM?
SOM is inspired by how our brain process sensory data. Brain
cortex has divided itself to separate areas to process sensory data (visual
data are processed in visual cortex, acoustic are processed in auditory cortex).
This means for the same input, same area of the brain is activated. Different signals
activate different parts.

Figure 1: Different Cortexes
I'm not lying. See...? Using this model we design a neural network which has the
ability to activate similar areas for similar inputs and different areas for
different inputs. When you do this... Alas! You have the self organizing map.
Is this making you feel sleepy…? How about a real world
example? (I'll be posting it very soon). But if you wait a little, you’ll get to know few cool terminologies
you can use to impress your friends. So if you’re not comfortable with
fundamentals I would recommend continuing reading this.
How does SOM work?
Sample data (patterns)
These are what you feed to the map. Map will change it’s
topology in the input space according to these data. These data will be
typically high-dimensional (ex. 3 or more). For example data could be color
(RGB values) animal (Mammal/Non-mammal, No of legs, Fly/Ground/Acquatic, etc.)
Neuron layer
SOM is a neuron layer. These neurons are also known as
prototypes. Each neuron has the same dimension as input data. Neuron layer
could be 1-dimensional (a line) or 2-dimensional (Rectangular or Hexagonal) (Figure 2). Only 1-dim or 2-dim is
common, as the number of dimensions increase the complexity of the map.
Input Space and output space
This is a very important thing to understand. SOM exist in
two spaces (atleast we imagine it to do so); Input Space and Output Space.
Following figure illustrate how the neurons topologically distributed in each
space. On the input space think in terms or weight of the neuron. In other
words position is determined by the weight of the neuron. Yes that means
changing neurons weight changes neuron’s position in input space; but not in
output space.
Output space is the really what we see. As I mentioned
earlier, these neurons are arranged in a line/rectangle/hexagon. This is in
output space. Here, think in terms or x,y corrdinates of the neuron. Also
neurons don’t more in the output space. And output space is very important due
to another reason, neighbor neurons to a particular neuron can be seen in this
space. Confusing huh!
Here’s a summary to make it atleast a little less confusing
Input Space Output
Space
Neuron’s weight represent position Actual x,y coordinates represent position
Neurons can move Neurons cannot
move
Help to find the winning neuron Help
to identify neighbors

Figure 2: Input space and output space. d1 and d2 are the distance between input and the neurons. This is the distance we use to select the "Winning neuron"
Now the algorithm…
I’ll take you on a helicopter tour over the algorithm. We’ll
pay attention to details later. :-) To help you with the understanding, I've attached images of an example. Input and neurons are balls. And their darkness represent the weight vector.
Initialization – Initialize the neuron layer with random
values (There are different ways to initialize, let’s stick with random for the
moment)
Competition – For each input neurons compute a value of a
discriminant function (usually the Euclidean distance) This is very important
as it’s the basis for their competition. Neuron wit the smallest value for
discriminant function wins.
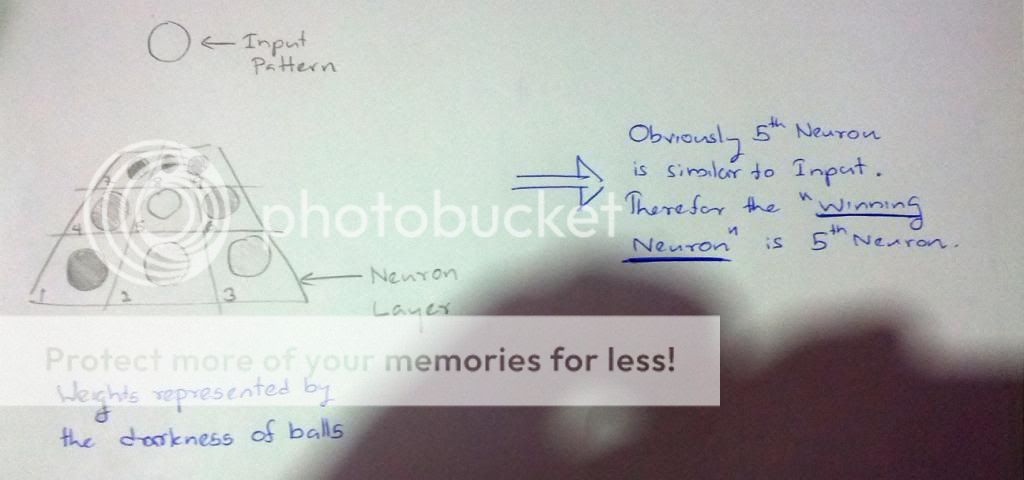
Figure 3: Difference between the darkness of input pattern and each neuron represent value of discriminant function
Cooperation – Winning neuron finds the neighbors (remember…
on the OUTPUT space) by determining his position on the lattice of neurons. So
he can cooperate with them to make the SOM better.

Figure 4: Finding the neighbors. Neighbors are the closest neurons to the winning neuron
Adaptation – Winning neuron + neighboring neurons moves
towards the input pattern (remember… on the INPUT space) And winning neuron
moves a lot towards the input. Neighboring neurons move less than the wining
neuron. (Extent of movement determined by a neighborhood function)

Figure 5: Now we make the selected neurons more like the input neuron. In other words, we move the neurons towards the input neuron in the INPUT space. In this case, we make the selected neurons more lighter.
Do all these for few 100 epochs (oh.. am I confusing you? Epoch
is just a fancy word for iteration) and you’ve got your self a pretty good SOM.
But not so fast… there are few more things that play part on your SOM. We’ll
talk about them in the coming section.
really good explanation
ReplyDeleteone question, this modelo can modelling species distribution? similar to maxent??
ReplyDeleteLoving your explanation.
ReplyDeleteThanks a Mill